
Exploring the Significance of Correlation Studies in Research
The Importance of Correlation Studies in Research
Correlation studies play a crucial role in research across various disciplines, from social sciences to natural sciences. A correlation study examines the relationship between two or more variables to determine if and how they are related.
One of the key benefits of conducting correlation studies is that they help researchers identify patterns and associations between different factors. By analysing the strength and direction of the relationship between variables, researchers can gain valuable insights into how changes in one variable may impact another.
Correlation studies are particularly useful in hypothesis testing and predictive modelling. They provide researchers with statistical evidence to support or refute hypotheses, helping to guide further research and decision-making processes.
Moreover, correlation studies can help researchers uncover hidden connections between variables that may not be immediately apparent. This can lead to new discoveries and a deeper understanding of complex phenomena.
It is important to note that correlation does not imply causation. While a strong correlation between two variables suggests a relationship, it does not necessarily mean that one variable causes the other to change. Careful interpretation of correlation results is essential to avoid drawing incorrect conclusions.
In conclusion, correlation studies are valuable tools in research that enable scientists and scholars to explore relationships between variables, test hypotheses, and make informed decisions based on empirical evidence. By utilising correlation analysis effectively, researchers can advance knowledge in their fields and contribute to meaningful discoveries that benefit society as a whole.
Essential Tips for Conducting a Robust Correlation Study
- Ensure that the data used for correlation analysis is continuous and follows a linear relationship.
- Understand the difference between positive, negative, and zero correlations.
- Be cautious of outliers in your data as they can significantly impact correlation results.
- Remember that correlation does not imply causation; it only shows a relationship between variables.
- Use appropriate correlation coefficients such as Pearson’s r or Spearman’s rho based on the nature of your data.
- Consider the sample size when interpreting correlation results; larger samples tend to provide more reliable estimates.
- Check for multicollinearity when dealing with multiple variables to avoid misleading correlation outcomes.
- Remember that perfect correlations are rare in real-world data; be cautious if you encounter them.
Ensure that the data used for correlation analysis is continuous and follows a linear relationship.
When conducting a correlation study, it is essential to ensure that the data used for analysis is continuous and follows a linear relationship. Continuous data allows for a more precise examination of the relationship between variables, as it provides a full range of values for analysis. Additionally, a linear relationship between variables simplifies the interpretation of correlation results, making it easier to assess the strength and direction of the association. By adhering to these guidelines and using appropriate data, researchers can conduct more accurate and meaningful correlation analyses that yield valuable insights into the relationships between variables.
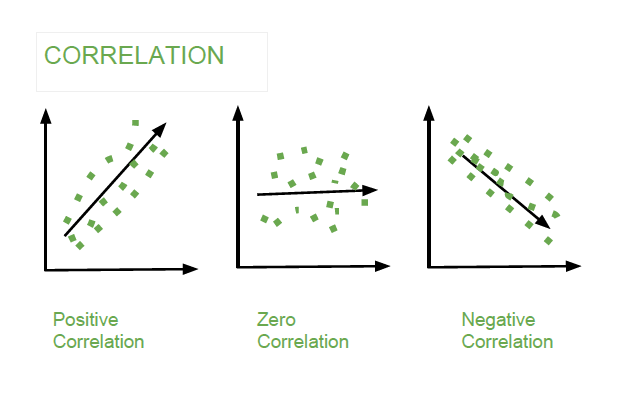
Understand the difference between positive, negative, and zero correlations.
Understanding the difference between positive, negative, and zero correlations is essential when conducting correlation studies. A positive correlation indicates that as one variable increases, the other variable also increases, demonstrating a direct relationship between the two factors. Conversely, a negative correlation suggests that as one variable increases, the other variable decreases, showing an inverse relationship. On the other hand, a zero correlation signifies no discernible relationship between the variables being studied. By discerning these distinctions in correlation patterns, researchers can accurately interpret their findings and draw meaningful conclusions about the relationships between variables in their research studies.
Be cautious of outliers in your data as they can significantly impact correlation results.
When conducting a correlation study, it is crucial to be cautious of outliers in your data as they can have a significant impact on the correlation results. Outliers are data points that deviate significantly from the rest of the dataset and can distort the relationship between variables. By skewing the data, outliers may lead to misleading correlation coefficients and inaccurate conclusions. Therefore, it is important to identify and handle outliers appropriately, such as through data cleaning or robust statistical methods, to ensure the reliability and validity of the correlation analysis.
Remember that correlation does not imply causation; it only shows a relationship between variables.
It is essential to keep in mind that correlation does not imply causation; it merely indicates a relationship between variables. While a strong correlation between two factors may suggest a connection, it does not confirm that changes in one variable directly cause changes in the other. It is crucial to exercise caution when interpreting correlation results and avoid making assumptions about cause-and-effect relationships without further evidence or analysis. Understanding this distinction is vital in conducting accurate and reliable research across various fields of study.
Use appropriate correlation coefficients such as Pearson’s r or Spearman’s rho based on the nature of your data.
When conducting a correlation study, it is essential to choose the appropriate correlation coefficient based on the nature of your data. For example, using Pearson’s r is suitable for assessing the strength and direction of a linear relationship between two continuous variables, assuming that the data follows a normal distribution. On the other hand, Spearman’s rho is more appropriate when dealing with ordinal or non-normally distributed data, as it measures the monotonic relationship between variables without relying on specific distribution assumptions. Selecting the right correlation coefficient ensures accurate and meaningful interpretation of the relationship between variables in your study.
Consider the sample size when interpreting correlation results; larger samples tend to provide more reliable estimates.
When interpreting correlation results, it is important to consider the sample size as a crucial factor. Larger samples generally tend to yield more reliable estimates in correlation studies. A larger sample size can help reduce the impact of random variability and increase the precision of the correlation coefficient, providing researchers with more confidence in the strength and direction of the relationship between variables. Therefore, researchers should aim to use sufficiently large samples to ensure the robustness and validity of their correlation findings.
Check for multicollinearity when dealing with multiple variables to avoid misleading correlation outcomes.
When conducting a correlation study involving multiple variables, it is crucial to check for multicollinearity to ensure the accuracy and reliability of the results. Multicollinearity occurs when two or more independent variables in a regression model are highly correlated with each other, which can lead to misleading correlation outcomes. By identifying and addressing multicollinearity issues, researchers can avoid inflated standard errors, unstable coefficients, and inaccurate interpretations of the relationships between variables. Taking steps to mitigate multicollinearity ensures that the correlation analysis provides meaningful and trustworthy insights into the underlying data patterns.
Remember that perfect correlations are rare in real-world data; be cautious if you encounter them.
When conducting a correlation study, it is essential to bear in mind that perfect correlations are seldom found in real-world data; therefore, encountering one should raise caution. Perfect correlations, where two variables have a correlation coefficient of +1 or -1, are rare and may indicate potential issues such as data errors, outliers, or overfitting. Researchers should approach perfect correlations with skepticism and investigate the underlying reasons behind them to ensure the reliability and validity of their findings. Understanding the context and limitations of correlation results is crucial for drawing accurate conclusions and making informed decisions based on the data analysis.